Introduction
If you’re a software developer you will have to debug code at one point or the other and the truth is that debugging in Neovim for the first time can be a daunting task.
The current status of debugging within Neovim requires lots of configuration compared to VS Code
The best way to debug code in my experience is using the Debug Adapter Protocol (DAP) with a tool called nvim-dap, if you want to know more about the details of how this works check the official information or my blog post.
In this blog post, we will see how to configure this tool to:
-
Debug node applications (Servers, files)
-
Debug web applications using Chrome
- How to keep the session state across multiple debugging
-
Supporting
.vscode/launch.jsonfiles
I will assume you already know how to:
-
Install packages in Neovim
-
Some basic understanding of Lua
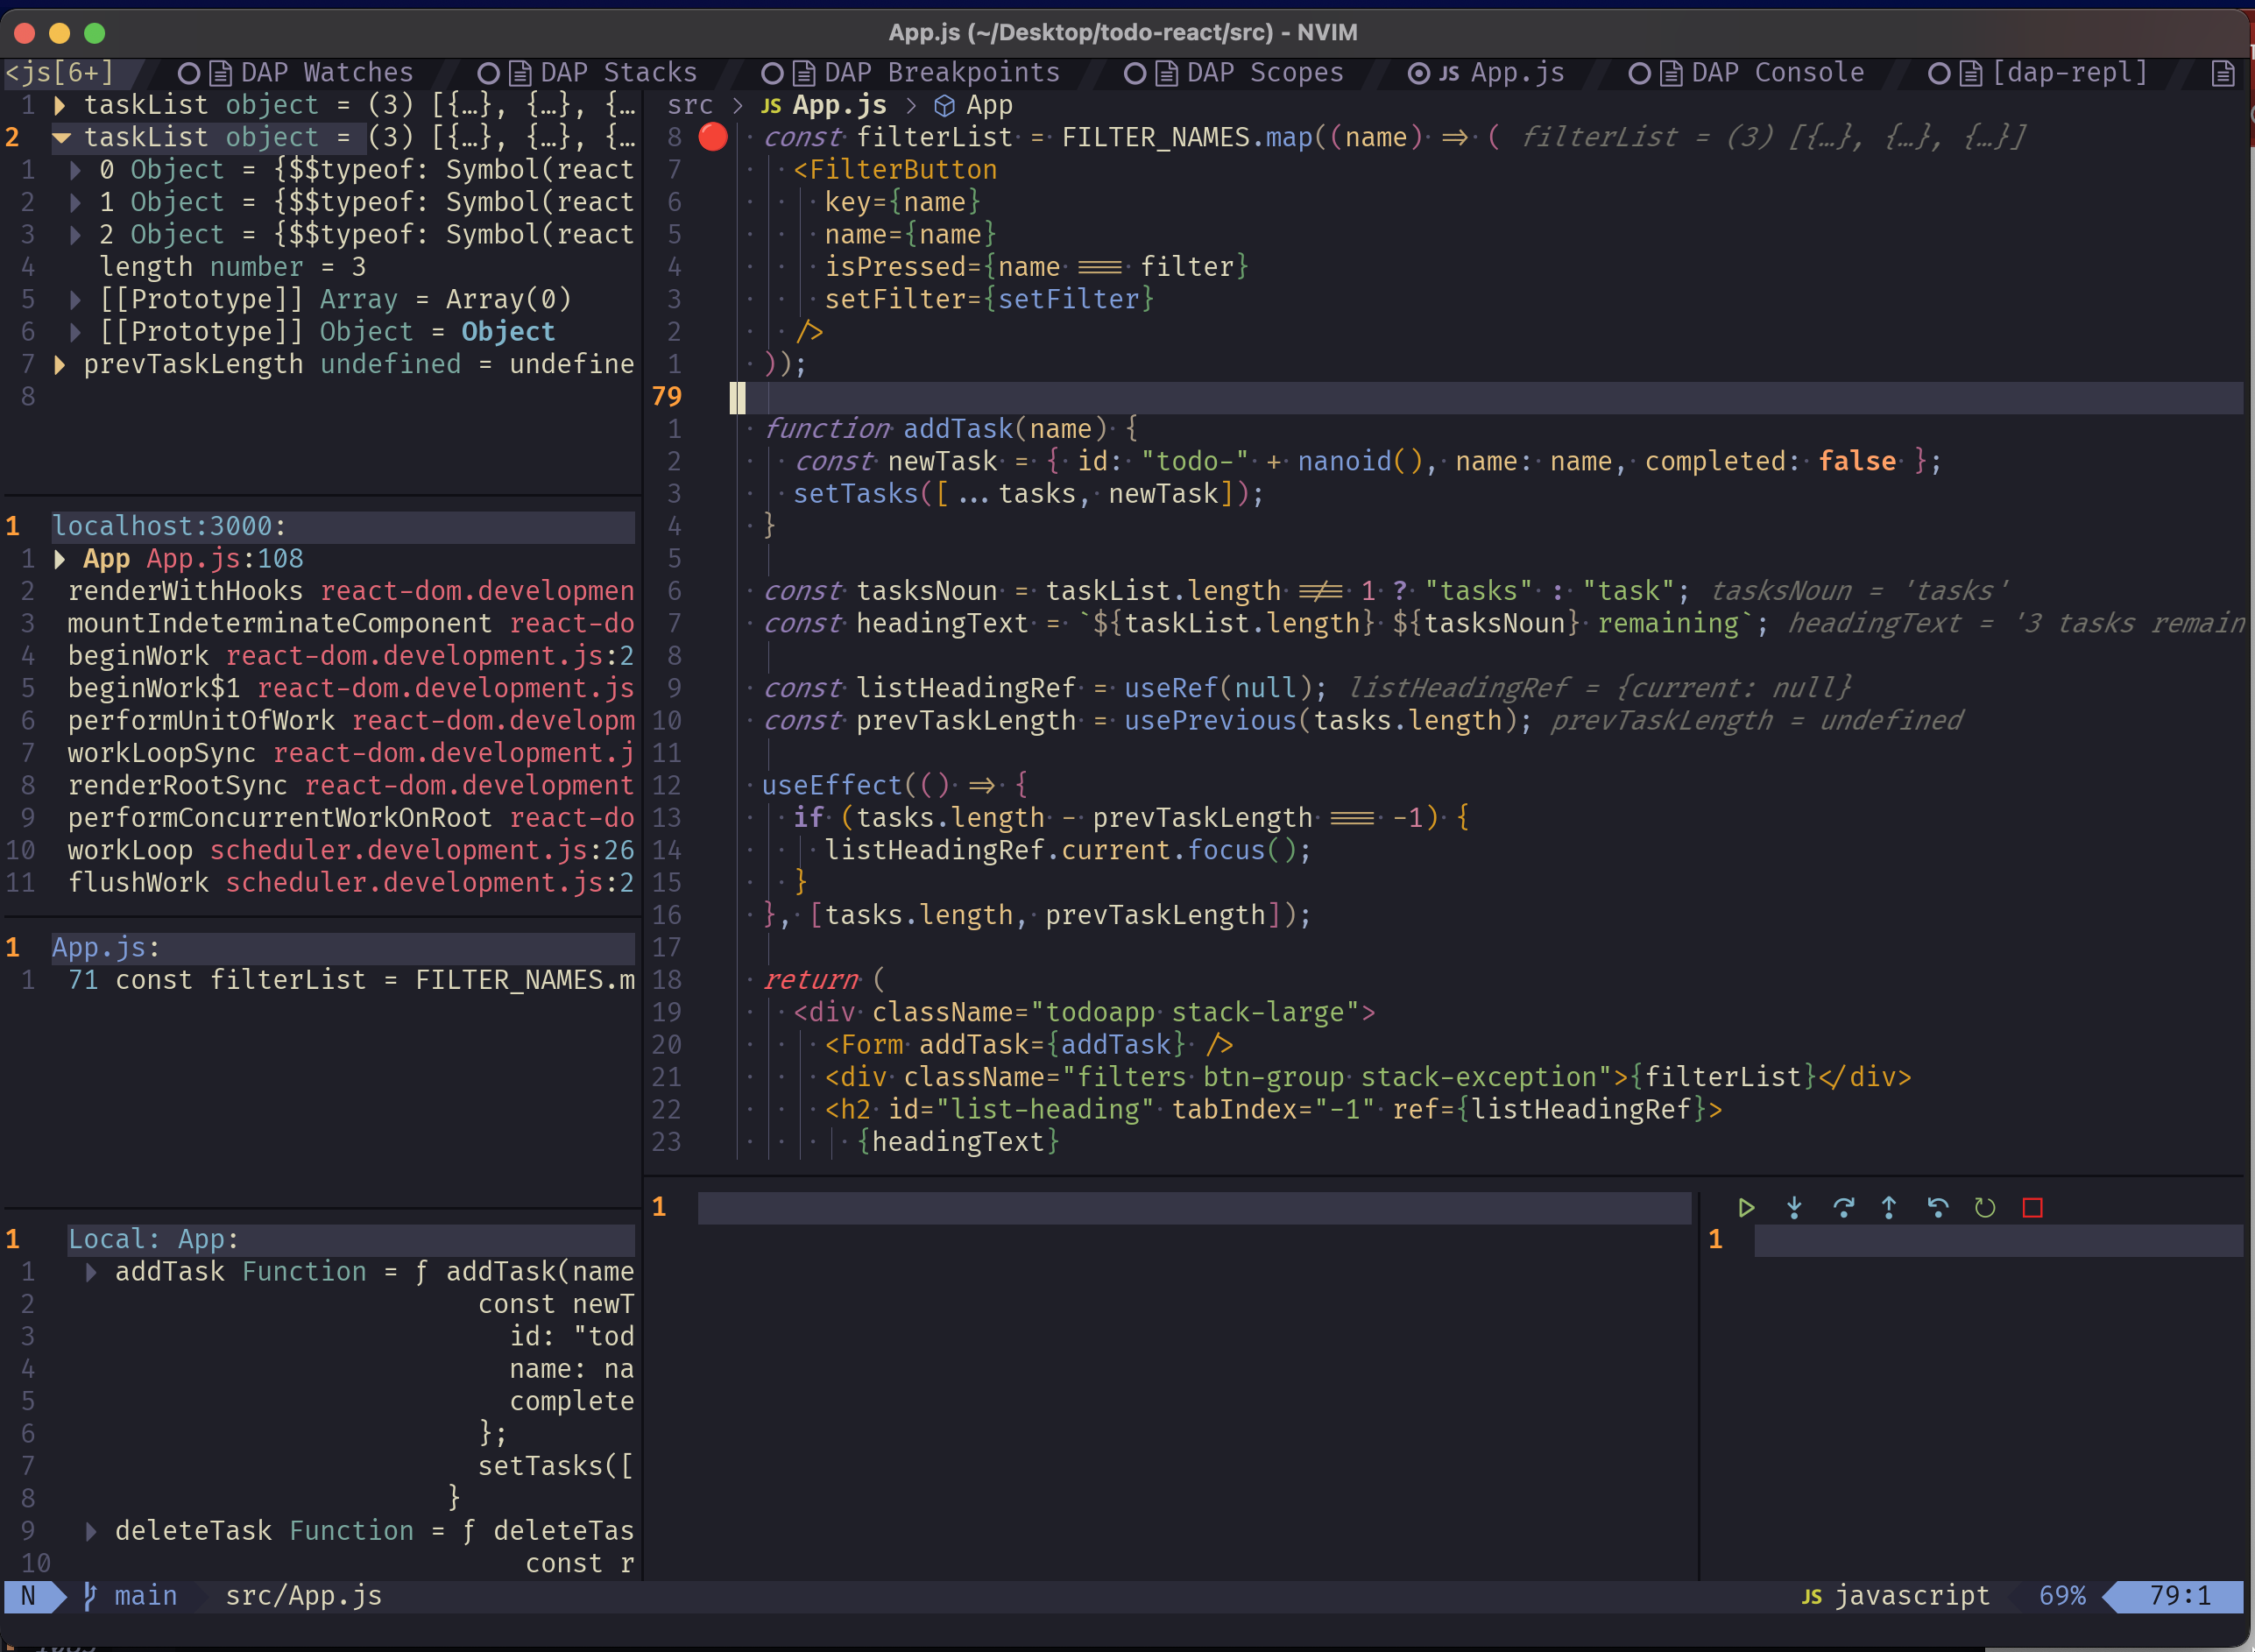
What is possible?
Let’s see what is currently possible with Neovim
My experience so far
In order to get to this level I sadly had to expend a lot of time because it was not a plug and play experience, the journey looked a bit like this:
-
Found out that debugging was possible using
nvim-dap, previously the only thing I was using VS Code for was to debug applications -
Read the
nvim-dapdocumentation and understand nothing because most of the documentation assumes knowledge about DAP -
Read the DAP documentation and begin to understand a bit :D
-
Look for
adaptersto debug Javascript, typescript and node applications in general -
Find
nvim-dap-vscode-jsand read the documentation and understand nothing cause most of the documentation is leveraging the official https://github.com/microsoft/vscode-js-debug documentation which only speaks about VS Code -
Look on the internet until finally get something to work
-
Be happy (But tired and sad that I needed to spent so much time in this)
The next steps in this post will show you how to configure your Neovim to do the same
Install nvim-dap
We will need to install nvim-dap, this tool is basically a DAP client in Neovim. In order to install it, you only need to add the following line in your favorite package manager
'mfussenegger/nvim-dap'Then we will load the plugin in our Neovim configuration and set some keymaps to better use DAP
local dap = require("dap")

-- Set keymaps to control the debugger
vim.keymap.set('n', '<F5>', require 'dap'.continue)
vim.keymap.set('n', '<F10>', require 'dap'.step_over)
vim.keymap.set('n', '<F11>', require 'dap'.step_into)
vim.keymap.set('n', '<F12>', require 'dap'.step_out)
vim.keymap.set('n', '<leader>b', require 'dap'.toggle_breakpoint)
vim.keymap.set('n', '<leader>B', function()
  require 'dap'.set_breakpoint(vim.fn.input('Breakpoint condition: '))
end)
In the previous step, we set up some keymaps to interact with nvim-dap like:
-
F5to start a new debugging session -
F10, F11, F12to move though the code once you’re in a debugging session -
leader bto toggle breakpoints -
leader Bto set conditional breakpoints
Install and configure nvim-dap-vscode-js
Next we need to install nvim-dap-vscode-js this is the adapter that allows Neovim (through the nvim-dap) to communicate with JavaScript and interestingly, it’s the same adapter used in VS Code.
- Again, install the package using your preferred plugin manager
mxsdev/nvim-dap-vscode-jsThen copy this into your configuration file, this lines of code was taken from the Official Github repository
require("dap-vscode-js").setup({
  -- node_path = "node", -- Path of node executable. Defaults to $NODE_PATH, and then "node"
  debugger_path = "(runtimedir)/site/pack/packer/opt/vscode-js-debug", -- Path to vscode-js-debug installation.
  -- debugger_cmd = { "extension" }, -- Command to use to launch the debug server. Takes precedence over `node_path` and `debugger_path`.
  adapters = { 'chrome', 'pwa-node', 'pwa-chrome', 'pwa-msedge', 'node-terminal', 'pwa-extensionHost', 'node', 'chrome' }, -- which adapters to register in nvim-dap
  -- log_file_path = "(stdpath cache)/dap_vscode_js.log" -- Path for file logging
  -- log_file_level = false -- Logging level for output to file. Set to false to disable file logging.
  -- log_console_level = vim.log.levels.ERROR -- Logging level for output to console. Set to false to disable console output.
})
Some of the problems you might have with the previous configuration:
debugger_path
If you’re using anything else than packer to install plugins you need to modify the debugger_path because the path might change depending on your plugin manager, for lazy, you need to change the debugger_path to be vim.fn.stdpath('data') .. "/lazy/vscode-js-debug"
- adapters
I needed to add chrome and node to the list of default adapters because I wanted to be able to use the configuration I have in VSCode in my Neovim, and VS Code refers to this adapter as just node and chrome instead of node-pwa and chrome-pwa
Configuring the DAP Adapter
In this step we will add some default configuration for our adapters, we will tell the adapters in what kind of languages we want to active it.
This configuration is based on the launch configuration from VS Code
local js_based_languages = { "typescript", "javascript", "typescriptreact" }

for _, language in ipairs(js_based_languages) do
  require("dap").configurations[language] = {
    {
      type = "pwa-node",
      request = "launch",
      name = "Launch file",
      program = "${file}",
      cwd = "${workspaceFolder}",
    },
    {
      type = "pwa-node",
      request = "attach",
      name = "Attach",
      processId = require 'dap.utils'.pick_process,
      cwd = "${workspaceFolder}",
    },
    {
      type = "pwa-chrome",
      request = "launch",
      name = "Start Chrome with \"localhost\"",
      url = "http://localhost:3000",
      webRoot = "${workspaceFolder}",
      userDataDir = "${workspaceFolder}/.vscode/vscode-chrome-debug-userdatadir"
    }
  }
end-
The first entry in the lua table will help you debug single
Node.js files -
The second will help you debug node processes like
expressapplications -
The last entry will help you debug
web applications- The line
userDataDirwill let you save your Chrome profile in a file
- The line
Now with this configuration you will be able to start debugging Javascript applications, but let’s add another plugin to make the interface easier to use
Install and configure dapui
To make the UI better, let’s install dapui
 With the following code, you will set up
 dapui and make the UI automatically open once a debugging session has been created, and also close the UI once the debugging sessions have finished
use { "rcarriga/nvim-dap-ui", requires = {"mfussenegger/nvim-dap"} }require("dapui").setup()
local dap, dapui = require("dap"), require("dapui")
dap.listeners.after.event_initialized["dapui_config"] = function()
dapui.open({})
end
dap.listeners.before.event_terminated["dapui_config"] = function()
dapui.close({})
end
dap.listeners.before.event_exited["dapui_config"] = function()
dapui.close({})
end
vim.keymap.set('n', '<leader>ui', require 'dapui'.toggle)Debugging your first code
Debugging single Javascript files
Open the file in your Neovim and press F5 and select Launch File, the dapui UI should appear and let you debug the code similarly to VS Code
If you copied the previous configurations, you will be able to go to a
Debugging server applications like express
Start the node process in any other tab in your terminal with the --inspect flag, e.g:
node --inspect ./app.jsNow press F5 and select Attach
Debugging a browser application
Open a JS file from the project and select Start Chrome with Localhost, the application must be running on port 3000 but you can change this in the previous configuration file
Sharing launch configuration with VS Code fans
This step is helpful if you’re planning to debug a project in which there’s already a launch.json file generated by VS Code users, for this we will need json5 because most of the launch.json that VS Code generates has comments inside and these are not valid JSON files
If you have a Mac
You would need to have installed rust
brew install rustup-initThen, you need to add the following line to your cargo config, usually it’s located in .cargo/config.toml .cargo/config.toml
[target.x86_64-apple-darwin]
rustflags = [
    "-C", "link-arg=-undefined",
    "-C", "link-arg=dynamic_lookup",
]

[target.aarch64-apple-darwin]
rustflags = [
    "-C", "link-arg=-undefined",
    "-C", "link-arg=dynamic_lookup",
]
Then install json5 plugin
- Packer
use {
    'Joakker/lua-json5',
    run = './install.sh'
}- Lazy
{
    'Joakker/lua-json5',
    build = './install.sh'
}
You will also need to add this line to your lua config, to be able to load the json5 plugin successfully
-- https://github.com/neovim/neovim/issues/21749#issuecomment-1378720864
-- Fix loading of json5
table.insert(vim._so_trails, "/?.dylib")require('dap.ext.vscode').load_launchjs(nil,
{ ['pwa-node'] = js_based_languages,
['node'] = js_based_languages,
['chrome'] = js_based_languages,
['pwa-chrome'] = js_based_languages }
)From now on, you should be able to debug applications in Neovim!
Find some bugs!